
Page 25 - Stanbic Bank IR 2024
P. 25
STANBIC BANK BOTSWANA LIMITED | Integrated Report 2024 23
Financial Performance
The Bank reported a 10.4% growth in the balance sheet, which has consequently driven a 43.7% growth in profit before taxation, and a
46.3% growth in profit after taxes. The growth is driven largely by the attainment of strategic intents namely, optimisation in processes
and capital consumption. This has been coupled with the use of data driven analytics together with an enhanced client engagement
model that seeks to co-create. The client engagement model largely seeks to drive client-led solutions as well as being an integral part of
client journeys. Our partnership with Kwenantle, which was driven by the client’s strategic outlook, ensuring we have embedded a
sustainable framework in the solution we extended, is an example of this.
All segments continue to post impressive results amidst challenging market conditions, as outlined below:
Corporate and Investment Business and Commercial Personal and Private
Banking (CIB) Banking (BCB) Banking (PPB)
Data analytics have been at the helm of the
CIB remains resilient amidst a challenging BCB continues to record strong significant improvement in profitability, a
macro-economic environment delivering performance despite a reduction in growth of more than 100%, alongside a
headline earnings growth of 22.7% to P323 profitability by 4.9%. The segment has significant improvement in credit
million. This has largely been supported by continued to improve book quality and impairments. Behavioral analytics have
loan origination, driven by our local closes the year with a credit loss ratio of aided in identifying fit-for-purpose solutions
corporate strategy – supporting home less than 2%. Further, the segment has for clients per segment and ensuring the
grown names with ambitions on the African seen an overall improvement in credit right levels of services are extended. The
continent. Further growth was also impairments with fewer instances of segment has seen a 29.8% growth in
anchored on the energy transition strategy strained clients in comparison to preceding Non-Interest Income. This is largely driven
and the demand for sustainable finance years. The segment has also made by enhancements in system accessibility,
products. Deposits from customers also deliberate efforts around client retention, improving transactability, together with
grew due to increased activity within our seeing progress made in investment in leaner processes which have made for
Transactional Banking business. Non- supporting technologies in this space. This simplified processing of client transactions.
Interest revenue grew by 16.1% mainly due makes it easy for clients to interact with our This has significantly boosted customer
to strong trading activities in the last solutions at their comfort. Capacity has retention as seen by 19.2% growth in
quarter of 2024 driven by increased client been released to ensure teams focus on liabilities.
activity and liquidity management servicing clients in much needed areas
opportunities. such as streamlining processes to
complement the system enhancements as
well as solution for specialised transactions.
The outlook for BCB remains optimistic as
our strategy is aligned to Government
interests and we will seek to partner to
solution for national interests, supporting
local businesses.
Balance sheet
Balance sheet structure
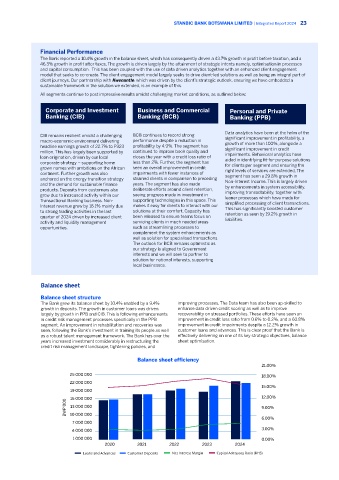
The Bank grew its balance sheet by 10.4% enabled by a 9.4% improving processes. The Data team has also been up-skilled to
growth in deposits. The growth in customer loans was driven enhance data driven credit scoring as well as to improve
largely by growth in PPB and CIB. This is following enhancements recoverability on stressed portfolios. These efforts have seen an
in credit risk management processes specifically in the PPB improvement in credit loss ratio from 0.6% to 0.2%, and a 60.8%
segment. An improvement in rehabilitation and recoveries was improvement in credit impairments despite a 12.2% growth in
seen, following the Bank’s investment in training its people as well customer loans and advances. This is clear proof that the Bank is
as a robust talent management framework. The Bank has over the effectively delivering on one of its key strategic objectives, balance
years increased investment considerably in restructuring the sheet optimisation.
credit risk management landscape, tightening policies, and
Balance sheet efficiency
21.00%
25 000 000 18.00%
22 000 000
15.00%
19 000 000
16 000 000 12.00%
BWP’000 13 000 000 9.00%
10 000 000
6.00%
7 000 000
4 000 000 3.00%
1 000 000 0.00%
2020 2021 2022 2023 2024
Loans and Advances Customer Deposits Net Interest Margin Capital Adequacy Ratio (RHS)